


(Week1)
1 Statistics
-> Art of learning from data
-> Concerned with collection of data
-> Subsequent Description and Analysis
1.1 Population: Total collection of all the items/elements that we are interested in.
1.2 Sample: Subset of the population used for detailed study.

Example: Suppose we take water bottles of all the boys in a hostel and randomly select 25 bottles. It is concluded that the capacity of 25 water bottles is 1L/bottle. Hence, the Sample consists of 25 bottles and the population consists of all the water bottles from the boy's hostel.
Major Branches of Statistics
Descriptive Statistics: Statistics which is concerned with the description and summarization of the main features of the dataset.
Inferential Statistics: Branch of statistics used to conclude from the data.
2 Data
Facts and figures collected, analyzed, and summarized for presentation and interpretation.
Types of data:
Unstructured Data: Dataset that is not organized in a predefined manner. Unstructured data requires more work to process and understand.
Ex: YouTube comments, Image files etc
"Data scattered with no structure "
Structured Data: Data that has a standardized format for efficient access by software and humans alike. structured data is easy to analyze and understand.
2.1 Variable and cases
Case(observation)/Row: Observation for which data is collected. (For each case same attribute is recorded.)
Variable/Column: Attribute that varies across all units. (The same type of value for each case is recorded.)
For ex.

In the above table, the individual name and age is a case(observation). While all names and ages in a column are Variables.
Classification of data

Categorical Data(Qualitative variable):
When observations can be classified into one of the categories instead of being measured numerically.
(*cannot perform any meaningful mathematical operation*)
For example, we have students' data from different colleges. The gender of students is categorical data because we have M or F categories to select.
Numerical data(Quantitative variable):
Describes the numerical properties of the data. It will always be a numerical value.
(*Mathematical operations can be performed*)
Ex- We have a dataset of students from different branches of a college. The number of students in a branch is the numerical property of data as the number of students is 60(assumed).
Time series Data:
Data recorded over a period of time is called time series data.
Ex- Temperature of place in 10 days
Cross-Sectional data:
Data recorded at the same time in different cases is called crossectional data.
Ex- Temperature of Dehradun, Chennai and Kanpur on the same day
Scales of measurement of data
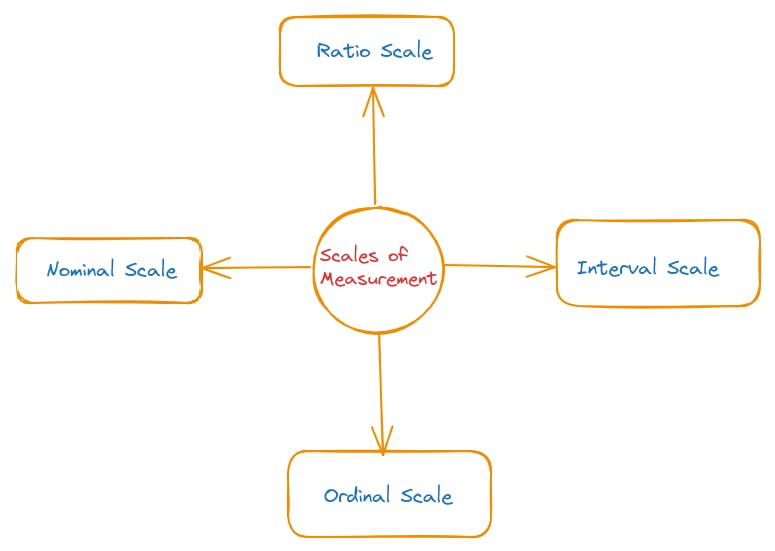
Nominal Scale: Measurement scale in which number serves as "tags" or "labels" only, to identify an object.
Ex- Discomfort of disease
1- mild
2-Moderate
3-Severe
Here 1=mild, 2=moderate and 3= severe in which 1,2,3 does not have numerical value rather it is used as labels for mild, moderate and severe.Here order or rank doesn't matter.
(*No ordering in the variables*)
Ordinal Scale: Data that exhibits properties of nominal data and the rank or order is meaningful is called ordinal scale.
(Distance between data is unknown)
Ex- Service rating by the customers
1-poor
2-good
3-excellent
here rank of rating matters therefore the scale is ordinal.
Interval Scale:
Similar to the ordinal scale and the distance(interval) between the values is expressed in terms of a fixed unit measure, the scale is called the interval scale.
Ex- Consider the temperature in the refrigerator is 6°C and the temperature outside the refrigerator is 35°C. The difference is 29°C.
Ratio Scale:
Similar to the interval scale and the ratio of the two values is meaningful, the scale is called the ratio scale.
Ex- For the marks of two students ratio is meaningful.
Thank you for reading my blog. (If any mistakes or corrections are required do comment below.)